[cryptowp price="bitcoin"]


Bitcoin has been sitting below $80,000 since the start of this week, and Ethereum, Solana and XRP all pulled back alongside it. If you only read the headlines, this looks like another “risk-off” day. The numbers behind the move tell a more useful story, and it’s one every trader should know how to read.
This article breaks down what actually pushed the market lower — not the narrative, but the mechanics — and what that means for how you manage risk around days like this.
The move: what the numbers show
On Monday morning, Bitcoin opened around $77,700, about 0.7% lower than Friday’s close, before recovering slightly to just under $78,000. Ethereum dropped further, close to 1.6%, sliding to around $2,450. Solana and XRP fell even more, down 3.6% and 2.7%.
None of this is a crash. It’s a pullback inside a market that’s still up roughly 20% over the past month — the kind of move that looks dramatic on a daily chart and barely registers on a monthly one.
What actually moved the price
Two mechanical factors did more work than any headline this week.
First, roughly $6.4 billion in Bitcoin options expired around the same time. Options expiry doesn’t move markets by itself, but it forces positioning — traders close hedges, market makers rebalance, and that creates real, temporary selling pressure that has nothing to do with sentiment.
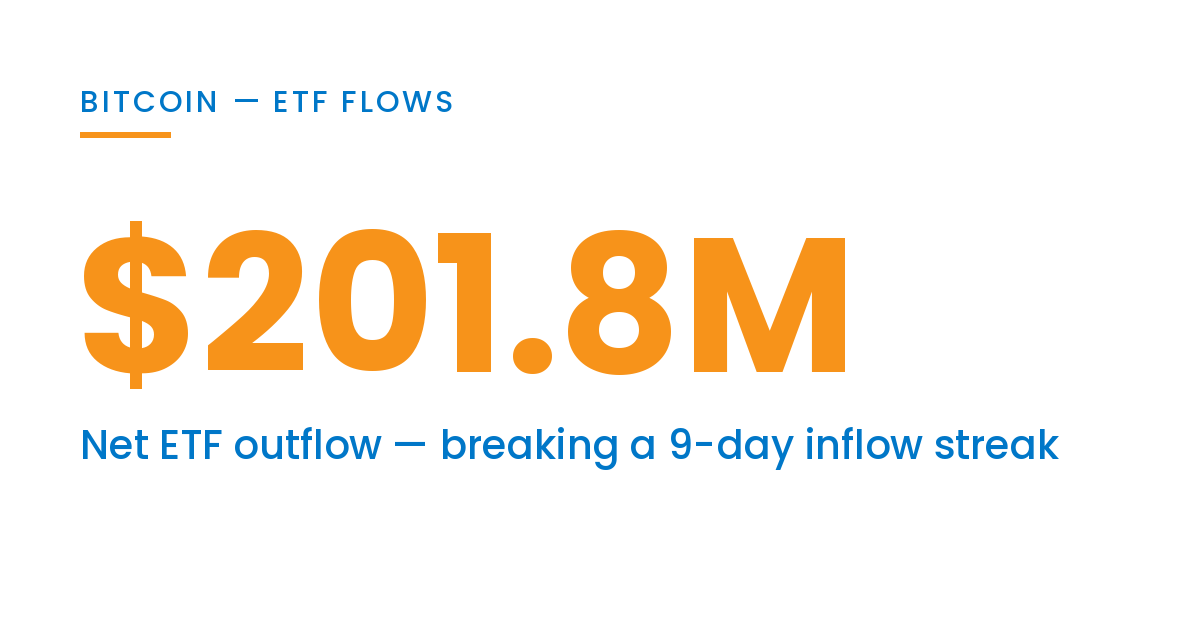
Second, US spot Bitcoin ETFs recorded $201.8 million in net outflows on Friday, breaking a nine-day streak of inflows and pushing total ETF assets back under $100 billion. That’s a real, verifiable number you can check yourself — it’s flow data, not an opinion piece. Nine days of buying pressure ending in one day of selling is exactly the kind of shift that shows up in price before it shows up in the news.
Add a broader risk-off mood in the wider market going into the weekend, and you get a pullback that looks bigger in the headlines than it is in the underlying data.
Why this matters more than the price itself
Here’s the part most retail traders skip: the size of a move tells you almost nothing on its own. What tells you something is whether the move was driven by structure — expiry, flows, positioning — or by a genuine change in what people believe Bitcoin is worth. Those two things call for completely different reactions.
A structural pullback, like this one, usually resolves itself once the mechanical pressure clears. A sentiment-driven pullback can keep going for weeks. Confusing the two is one of the most common reasons traders exit positions too early, or too late.
How I’d actually use this
I don’t trade the news. I trade the plan I set before the news happened. But I do check two things whenever there’s a sudden move: the options expiry calendar and the ETF flow data. Both are public, both update daily, and both tell you more about why price moved than any headline does.
Practically, that means:
- Before reacting to a red day, check whether there was a large options expiry in the last 24–48 hours. If yes, part of that move is mechanical, not directional.
- Watch ETF flow data as a slower-moving signal. A single day of outflows after nine days of inflows is normal profit-taking, not a trend reversal on its own.
- Keep your invalidation level — the price at which your original thesis is actually wrong — separate from “the price went down today.” A pullback inside a bigger uptrend doesn’t automatically break your plan.
Bitcoin is still below the $80,000 level it was testing before this pullback. Whether it gets back above that level depends on whether buyers show up once the mechanical pressure — the expiry, the outflow — has worked its way through the market. That’s not a prediction. It’s just the next thing worth watching.
Source: CoinDesk – Bitcoin options worth $6.4 billion just expired